Strategies
FUTURES Strategies
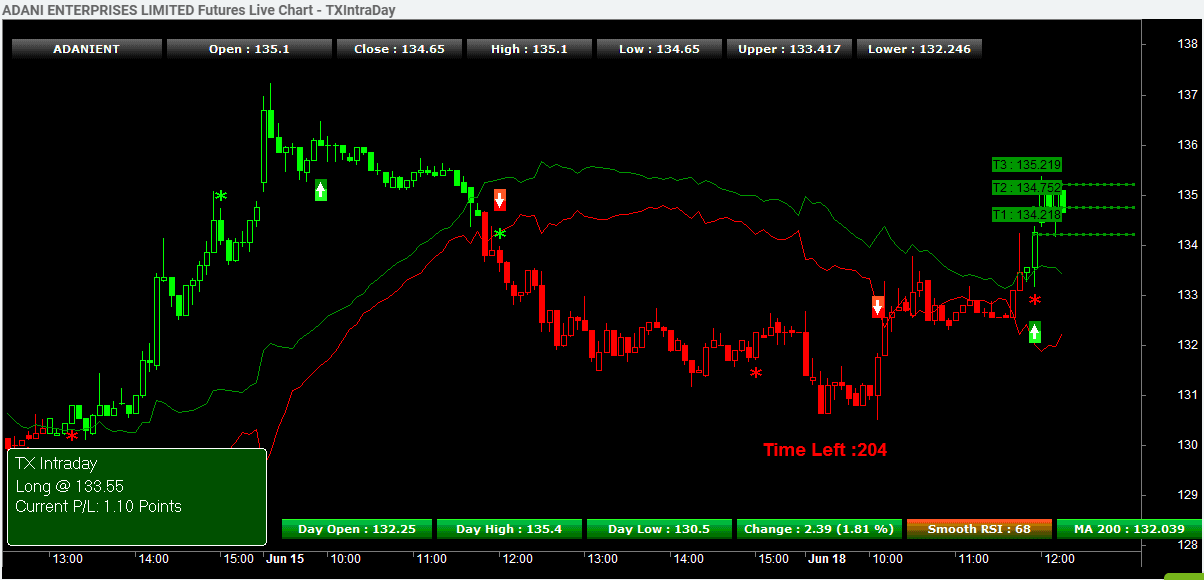
TXIntraday
Proprietary Long Short Intraday trading model for professional intraday players designed to provide a good risk-reward ratio and take an advantage of small and big trending moves in the market.
Entry Timings:
First Buy/Sell Signal Entry is designed to show post 9.30A.M. Till then it is a no trade zone. No fresh positions will be executed.
Exit Timings:
Any Open Positions(Long/Short) will be exited at 3.00P.M to close the day flat no positions will be carry forwarded.
| Green Up Arrow Represents | Long/Buy Signal |
| Green Star Indicates | Exit Long Positions |
| Red Down Arrow Represents | Short/Sell Signal |
| Red Star Represents | Exit Short Positions |
| Formation of Green Bar | Get Ready for Buy |
| Formation of Red Bar | Get Ready for Sell |
Dashboard tracks the current open position profit and loss and also pre-informs the upcoming trade to be executed in the form of limit order.
For Example :
When the dashboard shows
Get Ready to Buy Above - 9600
It indicates future long/buy signal formation above 9600 else the old short signal continues.
When the dashboard shows
Get Ready to Short below - 9650
It indicates future short/sell signal formation below 9650 else the old buy signal continues.
Wait for the Close of the Candle to Get Ready for Long or Short Signal
No Trade Day :
It is a status to avoid bad trading signals or whipsaws.
No Signals will be generated for that particular day.
This status can be identified in Charting Dashboard(Bottom Left Corner of the Chart).
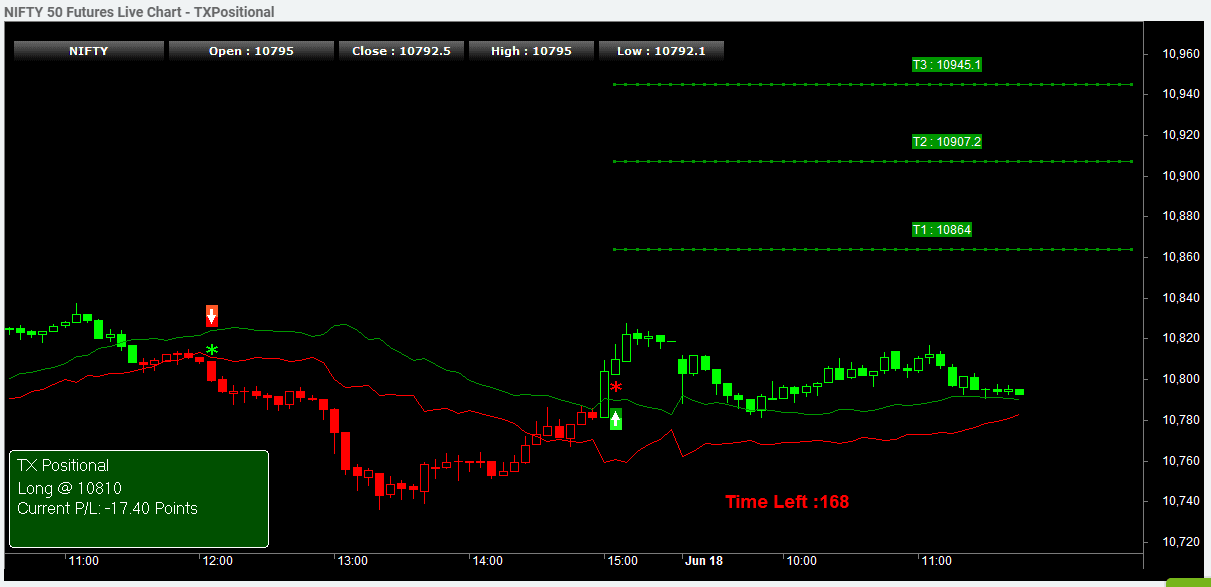
TXPositional
Proprietary Long Short positional trading model for professional traders designed to provide good risk-reward ratio and take advantage of small and big trending moves in the market.
| Green Up Arrow Represents | Long Signal |
| Green Star Indicates | Exit Long Positions |
| Red Down Arrow Represents | Short Signal |
| Red Star Represents | Exit Short Positions |
| Formation of Green Bar | Get Ready for Buy |
| Formation of Red Bar | Get Ready for Sell |
Dashboard tracks the current open position profit and loss and also pre-informs the upcoming trade to be executed in the form of limit order.
For Example :
When the dashboard shows
Get Ready to Buy Above - 9600
It indicates future long/buy signal formation above 9600 else the old short signal continues.
When the dashboard shows
Get Ready to Short below - 9650
It indicates future short/sell signal formation below 9650 else the old buy signal continues.
Wait for the Close of the Candle to Get Ready for Long or Short Signal Position Carry Forward.
It is a Stop and Reverse system with advance trading features. Any Positions which ends with long/short has to be carry forwarded overnight for the next day or next week. System will be always in trade 24x5.
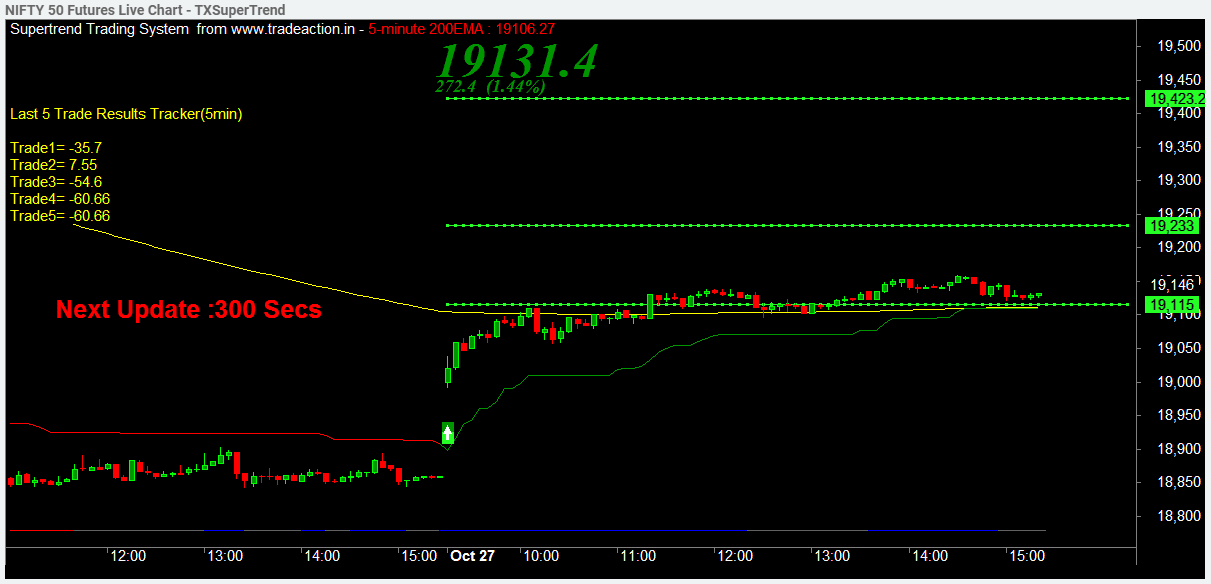
TXSupertrend
Supertrend is a carry forward strategy which involves overnight gapup/gapdown risk and also weekend carry forward risk. It is not a pure intraday strategy.
Supertrend normally makes more profit when the volatility increases and makes lesser losses when the market shows compressed volatility.
Most of the profits are made in gap up and gap down openings compared to the losses made in gap up/gap down.
Entry should be based on the completion of the close of 5min Bar Candle. Trade should be executed with 5secs once the 5min candle complete. Trade should not be executed before the completion of 5min bars.
Trading System:
Currently the trading system is optimized for only Nifty futures 5min charts. It may or maynot suits other instruments shown here.It is recommended to trade only volatile and High Beta Stocks on 5min time frame
Buy and Sell Indications:
Those Green and Red Ribbons are called as iTrend Ribbons . iTrend Ribbons are nothing but the additional filters to avoid whipsaws in our trades. We show the Trading Signals(Buy and Sell Arrows), Trailing Stop loss lines and the Multi-time frame Signal Dashboard.
Multi-time frame dashboard:
Multi-time frame dashboard is shown here to observe what is happening in the other time frame. However Super trend is not a multi-time frame strategy and higher time frames often involves higher risk. Its better to stick with 5min time frame for a better risk control in the long term.
COMMODITY Strategies
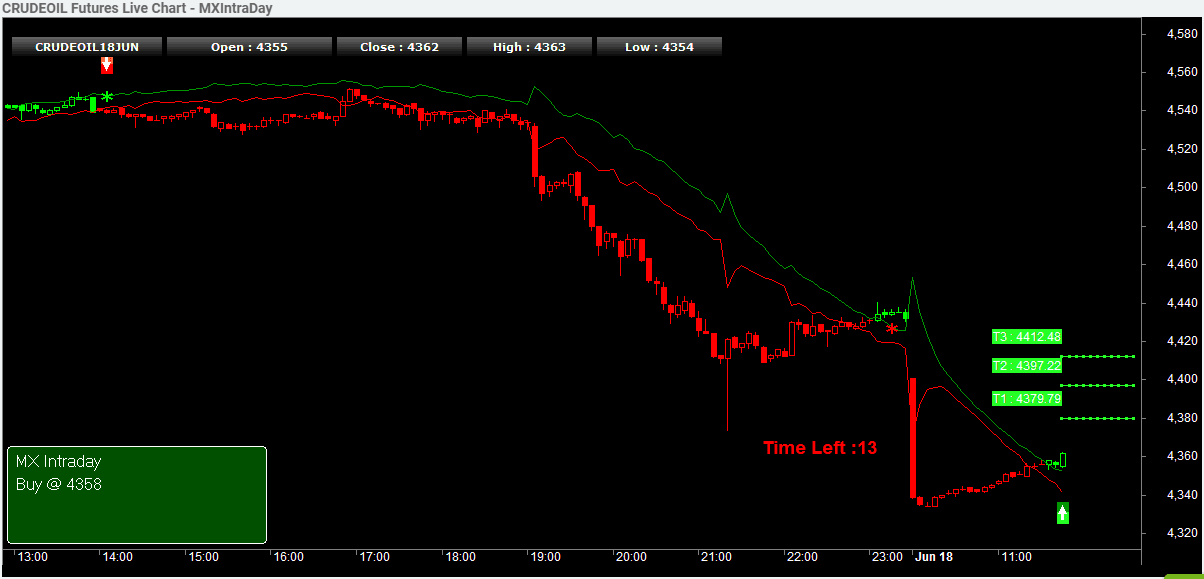
MXIntraday
Proprietary Long Short Intraday trading model for professional intraday players designed to provide a good risk-reward ratio and take an advantage of small and big trending moves in the market.
Entry Timings:
First Buy Sell Signal Entry is designed to show post 10.15A.M. Till then it is a no trade zone. No fresh positions will be executed.
Exit Timings:
Any Open Positions(Long/Short) will be exited at 11.15P.M to close the day flat no positions will be carry forwarded.
| Green Up Arrow Represents | Long Signal |
| Green Star Indicates | Exit Long Positions |
| Red Down Arrow Represents | Short Signal |
| Red Star Represents | Exit Short Positions |
| Formation of Green Bar | Get Ready for Buy |
| Formation of Red Bar | Get Ready for Sell |
Dashboard tracks the current open position profit and loss and also pre-informs the upcoming trade to be executed in the form of limit order.
For Example :
When the dashboard shows
Get Ready to Buy Above - 9600
It indicates future long signal formation above 9600 else the old short signal continues.
When the dashboard shows
Get Ready to Short below - 9650
It indicates future short signal formation below 9650 else the old buy signal continues.
Wait for the Close of the Candle to Get Ready for Long or Short Signal
No Trade Day :
It is a status to avoid bad trading signals or whipsaws.
No Signals will be generated for that particular day.
This status can be identified in Charting Dashboard(Bottom Left Corner of the Chart).
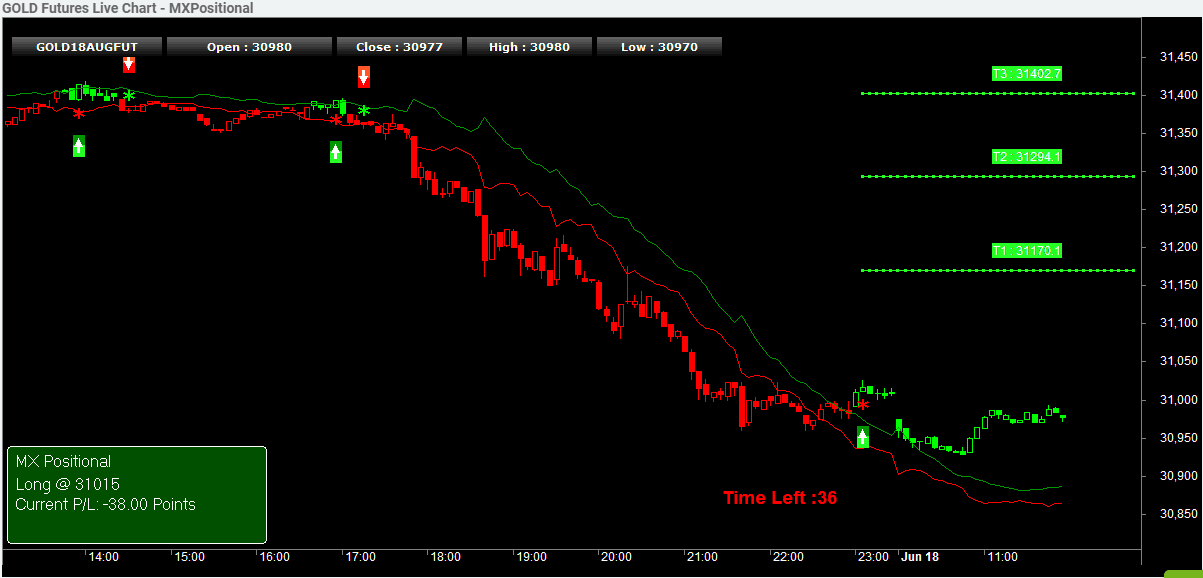
MXPositional
Propreitery Long Short positional trading model for professional traders designed to provide good risk-reward ratio and take advantage of small and big trending moves in the market.
| Green Up Arrow Represents | Long Signal |
| Green Star Indicates | Exit Long Positions |
| Red Down Arrow Represents | Short Signal |
| Red Star Represents | Exit Short Positions |
| Formation of Green Bar | Get Ready for Buy |
| Formation of Red Bar | Get Ready for Sell |
Dashboard tracks the current open position profit and loss and also pre-informs the upcoming trade to be executed in the form of limit order.
For Example :
When the dashboard shows
Get Ready to Buy Above - 9600
It indicates future long/buy signal formation above 9600 else the old short signal continues.
When the dashboard shows
Get Ready to Short below - 9650
It indicates future short/sell signal formation below 9650 else the old buy signal continues.
Wait for the Close of the Candle to Get Ready for Long or Short Signal Position Carry Forward.
It is a Stop and Reverse system with advance trading features. Any Positions which ends with long/short has to be carry forwarded overnight for the next day or next week. System will be always in trade 24x5.
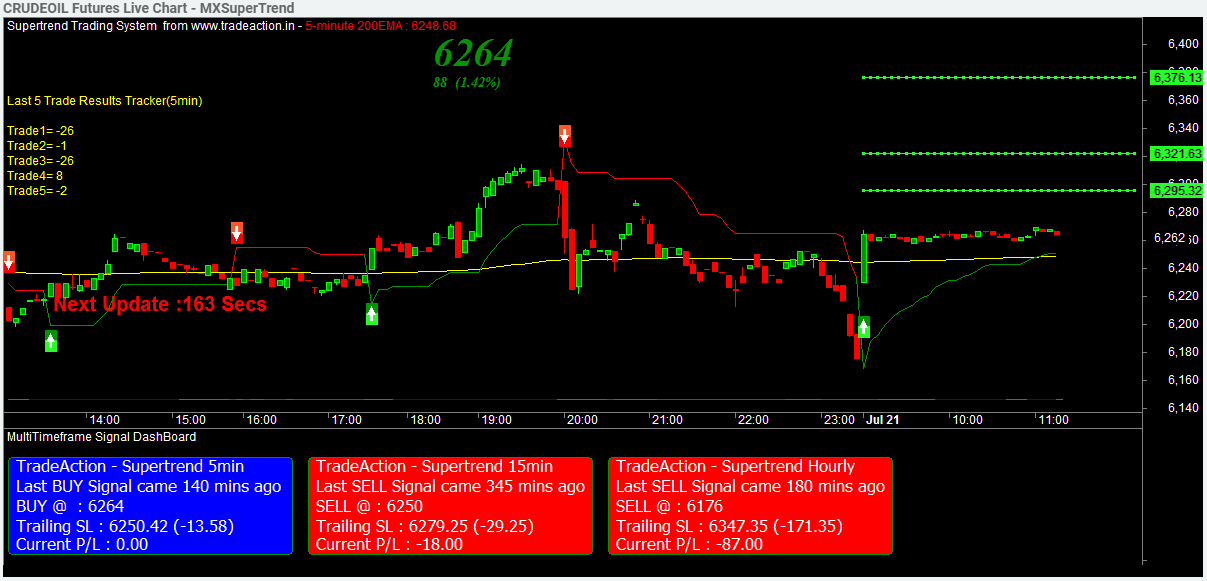
MXSupertrend
Supertrend is a carry forward strategy which involves overnight gapup/gapdown risk and also weekend carry forward risk. It is not a pure intraday strategy.
Supertrend normally makes more profit when the volatility increases and makes lesser losses when the market shows compressed volatility.
Most of the profits are made in gap up and gap down openings compared to the losses made in gap up/gap down.
Entry should be based on the completion of the close of 5min Bar Candle. Trade should be executed with 5secs once the 5min candle complete. Trade should not be executed before the completion of 5min bars.
Trading System:
Currently the trading system is optimized for only Nifty futures 5min charts. It may or maynot suits other instruments shown here.It is recommended to trade only volatile and High Beta Stocks on 5min time frame
Buy and Sell Indications:
Those Green and Red Ribbons are called as iTrend Ribbons . iTrend Ribbons are nothing but the additional filters to avoid whipsaws in our trades. We show the Trading Signals(Buy and Sell Arrows), Trailing Stop loss lines and the Multi-time frame Signal Dashboard.
Multi-time frame dashboard:
Multi-time frame dashboard is shown here to observe what is happening in the other time frame. However Super trend is not a multi-time frame strategy and higher time frames often involves higher risk. Its better to stick with 5min time frame for a better risk control in the long term.
Performance Rank
Performance Rank
It is an indicator which filters the symbol with the most profitable buy sell signals for the past 30 days, 7 days & a day.
Performance Rank is an indicator of the performance of our buy sell signals for a given symbol for the past month, week or a day.
![]()
How to check Performance Rank
By default performance rank will indicate the buy sell signals generated for a symbol traded for the day. Typically the rank is updated around 05.00 p.m – 05.30 p.m after the trading session. This information is useful for post market analysis.
Filtering can be done based on the signal type and symbol.
• In Monthly Performance Rank you can see the list of symbols performed in last 30 days performance.
![]()
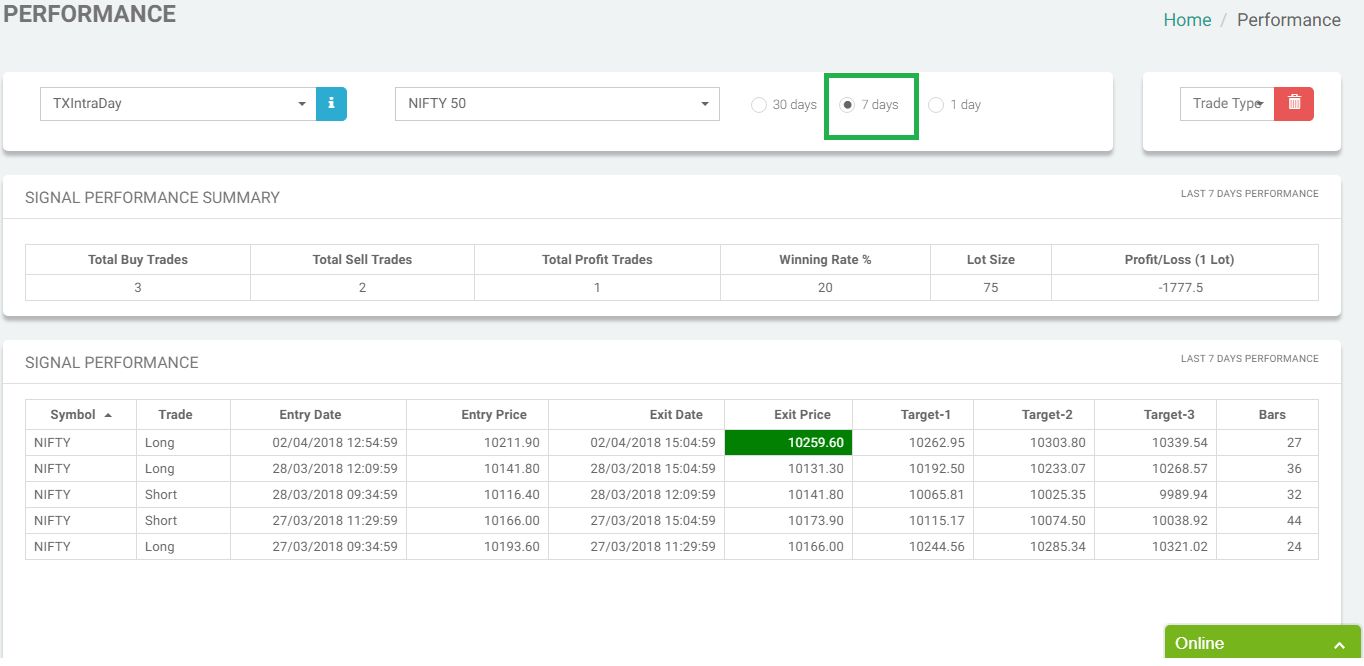
• In Weekly Performance Rank you can see the list of symbols performed in 7 days performance.
![]()
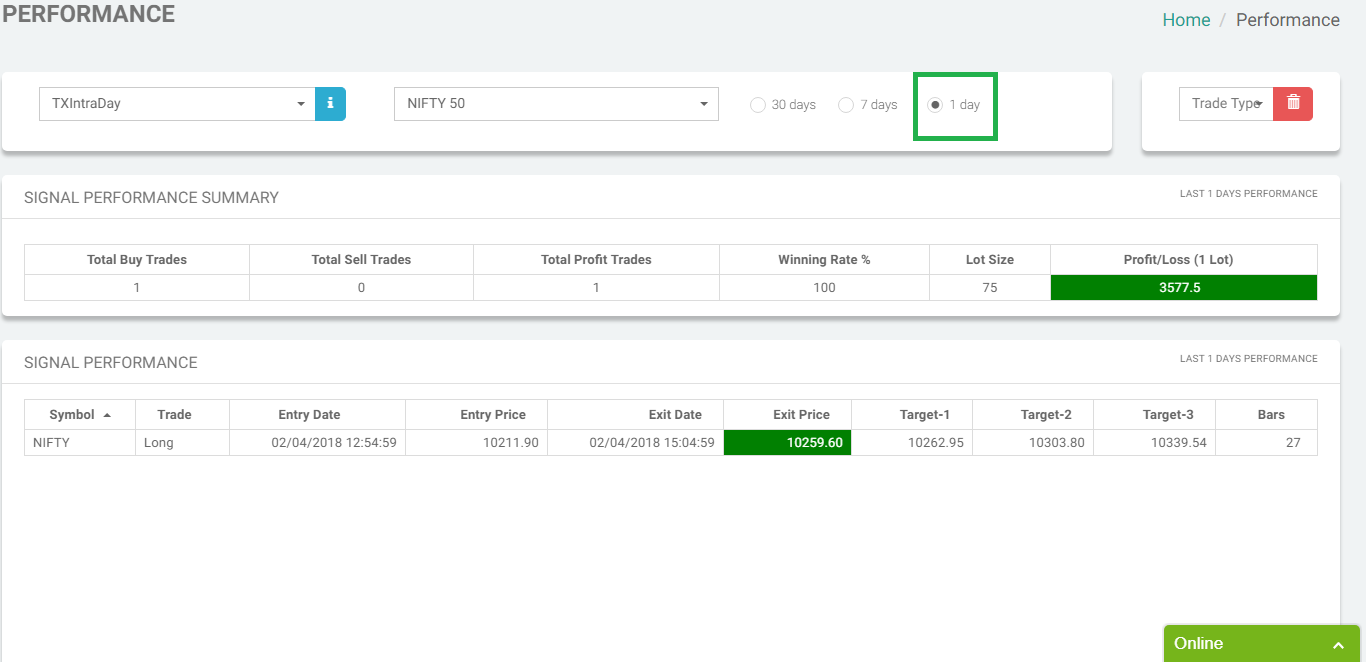
• In Daily Performance Rank you can see the list of symbols performed in today performance.
![]()
Performance
Performance
Performance is an indicator to showcase the success of our buy sell signals. It indicates whether our buy sell signals have achieved the generated targets.
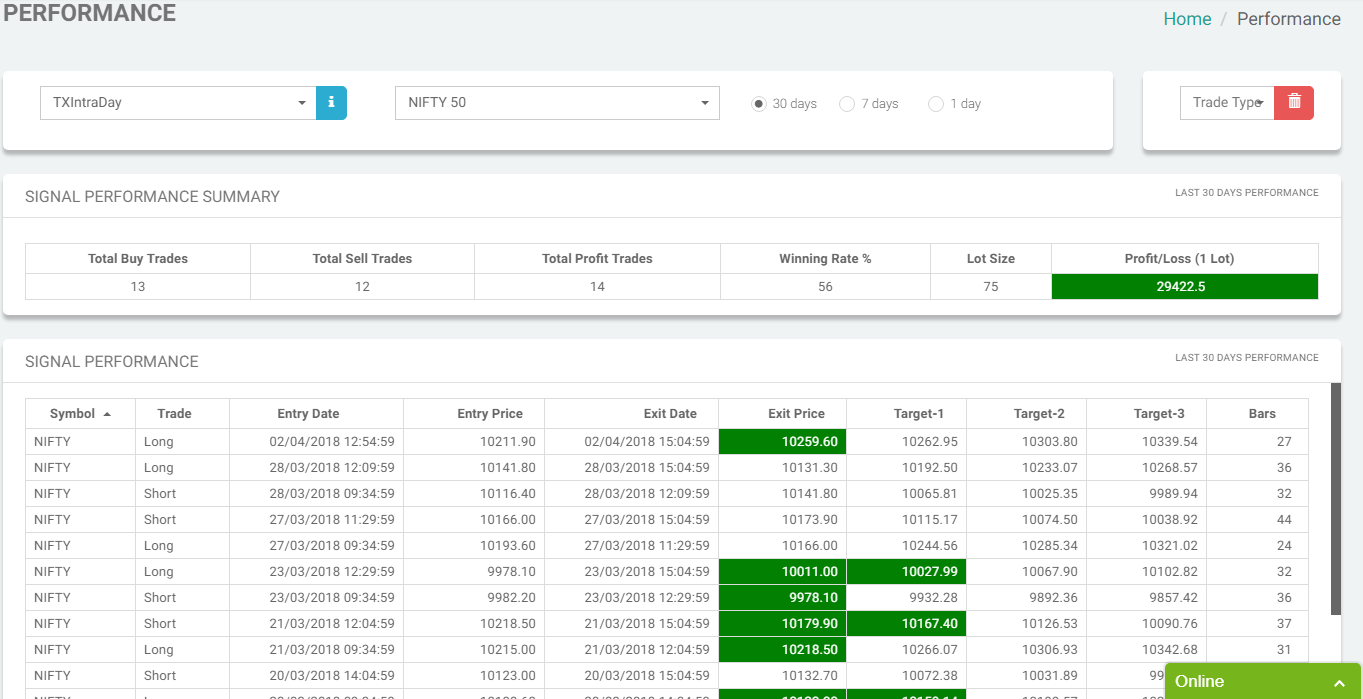
How to check Performance
By default performance will indicate the buy sell signals generated for a symbol traded for the day. Typically the performance is updated around 05.00 p.m – 05.30 p.m after the trading session. This information is useful for post market analysis.
Filtering can be done based on the signal type and symbol.
• In Monthly Performance you can see the last 30 days performance of the symbol.
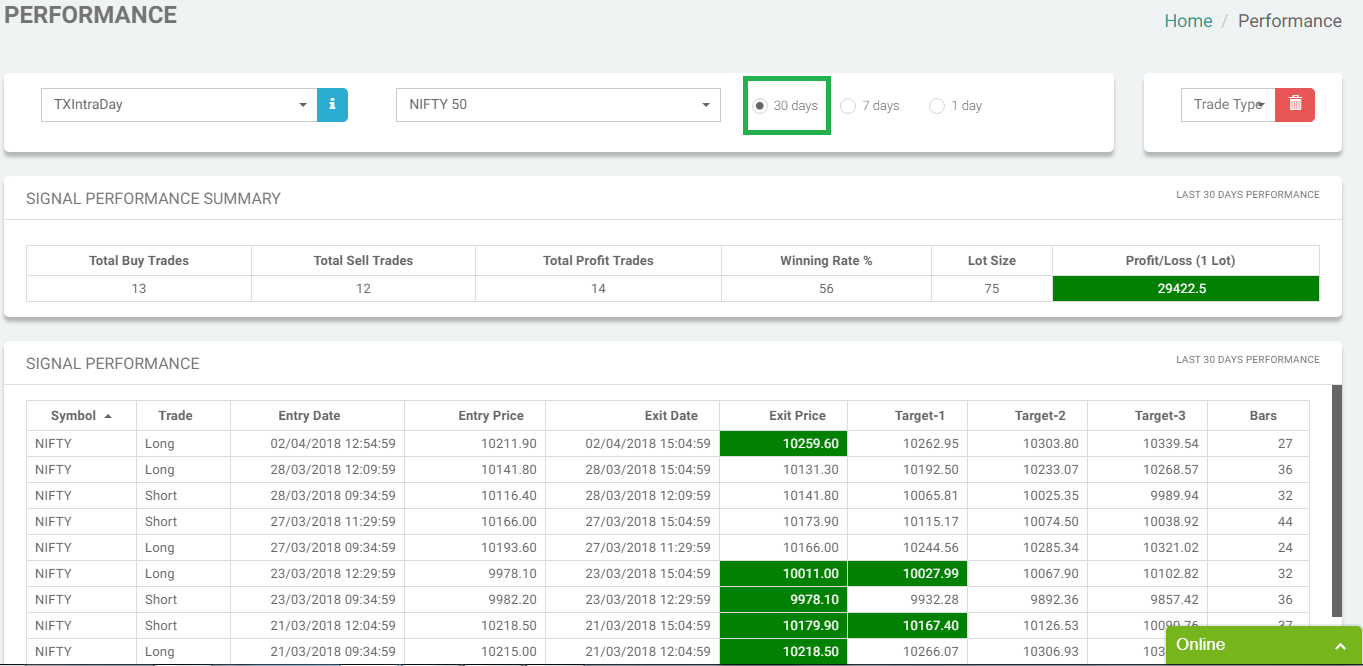
• In Weekly Performance you can see the last 7 days performance of the symbol.
• In Daily Performance you can see the today performance of the symbol.
Market scanners
All-In-One
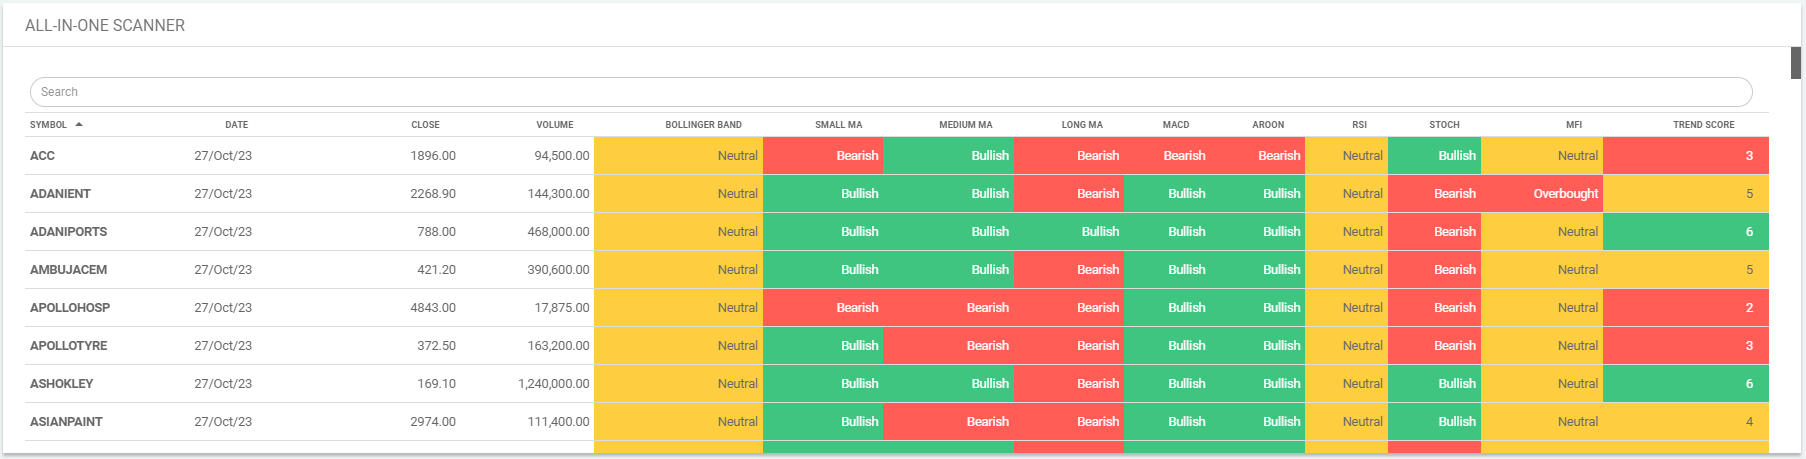
About All-In-One
All-In-One is a market analysis scanner using various standard indicators like Bollinger Band, Small MA, Medium MA, Long MA, MACD, Aroon, RSI, Stoch, MFI and with Trend Score.
VOLUME SHOCKERS
About VolumeShockers
Volume Shocker is a smart money flow scanner to identify where the smart money is parked in the first 1 hour of trading. When we talk about smart money, it generally refers institutions / insiders who knows better information than the general Trading/Investing crowd.
Ideally speaking, most of the smart money holding period ranges anywhere between few days and few weeks or even months. When comes to futures trading we use first 1 hour volume and open interest to identify the smart money flow.
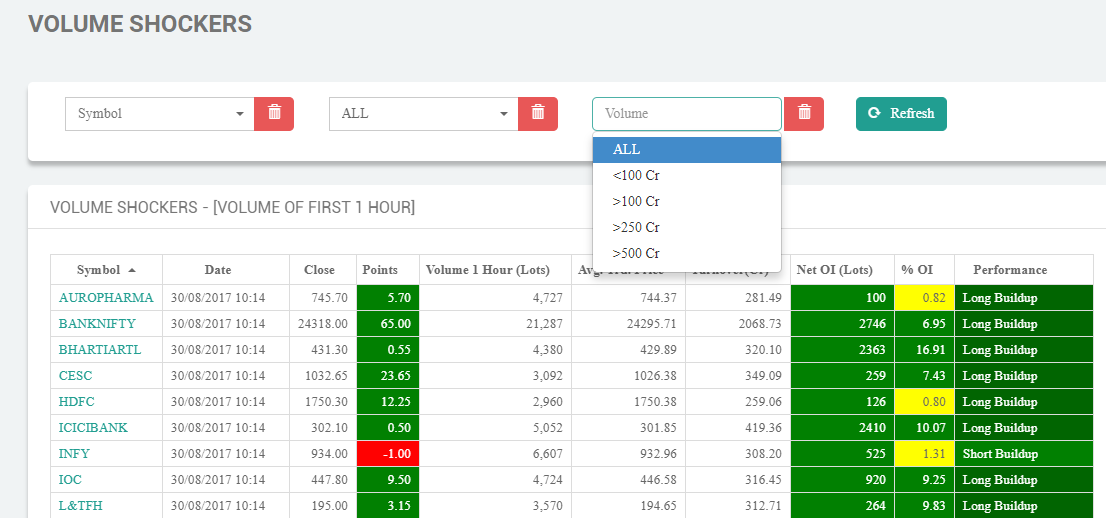
For ease of use, TRADEx users can identify the smart money flow by using Volume Shockers Scanner with yellow highlighter as shown below.
In Equity Derivative markets, if any of the stock futures first 1 hour turnover increases more than 300Cr to 800Cr range or more than that with greater open interest addition which is significantly higher from the last 30 days of first 1 hour turnover then possibly smart money role is there provided there is no news or event based speculation.
Because event based speculation attracts higher turnover. For Example
1)Political Events (Govt Policies, Election Results, Geo Political Events)
2)Earning Results
3)RBI Announcements
4)Corporate Actions(Split,Bonus,etc)
5) Grading the stocks by Rating Agencies/Brokers like CLSA, Moody’s
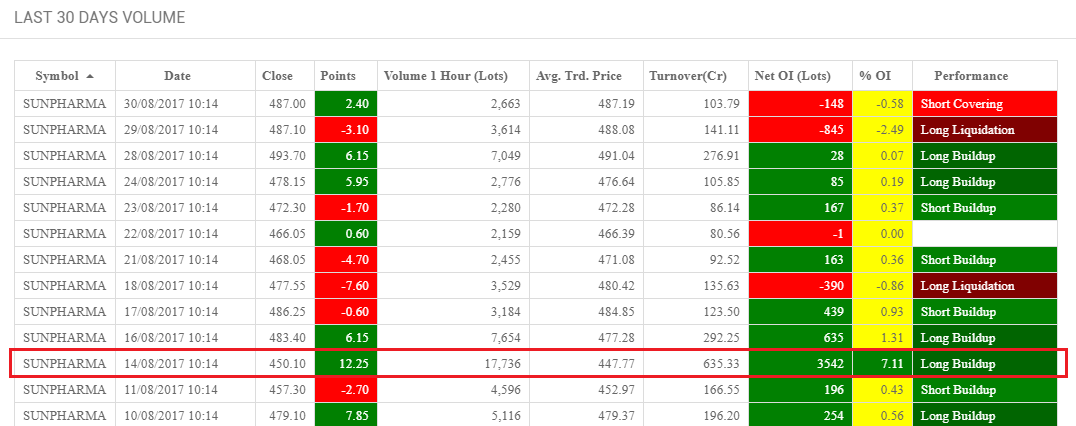
Apart from these speculative action, if a stock attracts huge turnover then smart money role is heavily involved there. Recent Examples are, Sunpharma made a short term bottom on 14th Aug 2017 where the turnover was 635 cr with significant open interest additions 7% – Long Buildup in the first 1 hour of trading. Volume traded in that first 1 hour was above 30 days average.
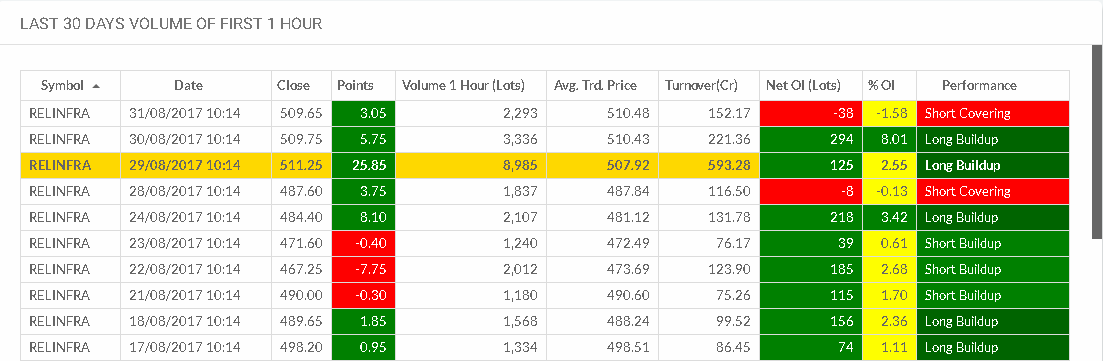
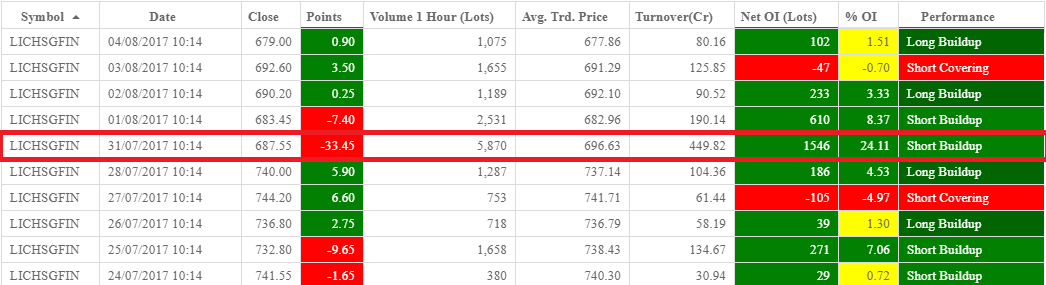
Another classical example is, LICHSGFIN made 24% Open Interest short addition in the first 1 hour of trading with 449Cr turnover which is greater than the 30 days average. Volumes happened in the first 1 hour is quite abnormal which indicates that smart shorts entered in the system with an average traded price of Rs696.63.
How to Scan for high volume/turnover?
Once you launch volume shockers screen by default you will get the list of stocks traded in the first 1 hour. Typically updates happens anywhere around 10.15a.m – 10.30a.m during the trading session. You can also use this information for post market analysis as well.
Further filtering can be done based on the symbol, turnover or Open Interest Interpretation.
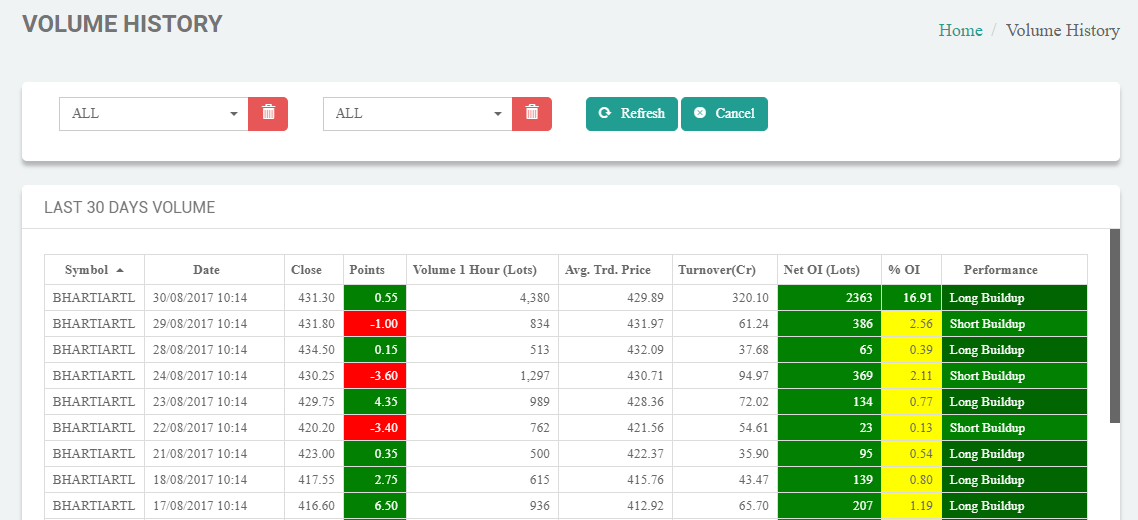
Now to get the historical first 1 hour information you can click on the listed stock. Once you selected the stock you will get last 30 days of historical volume for the first 1 hour of trading.
How I can benefit from this Volume Shockers Scanner?
If you are a positional trader then Volume Shocker tool gives you a tremendous edge in identifying smart money behavior and also helps you to hedge your cash position if in case you have a position already in the equity market.
I am a Intraday Trader, can I take advantage of this tool?
No, This Volume Shockers tool is highly recommended and built for positional traders. Because most of the time market movement would have already been done by the smart money in the first 1 hour of trading. so intraday traders hardly benefit from the move.
Note : Nifty and Bank Nifty usually have high turnover (typically 1000Cr – 2000Cr in the first 1 hour of trading) as they are mostly active traded securities in derivative segment.
OPEN-HIGH-LOW-CLOSE
About Open-High-Low-Close
Open-High-Low-Close Scanner is a technique used to filter out scrips that have open=high/prev.dayhigh | open=low/prev.daylow | open=prev.dayclose.
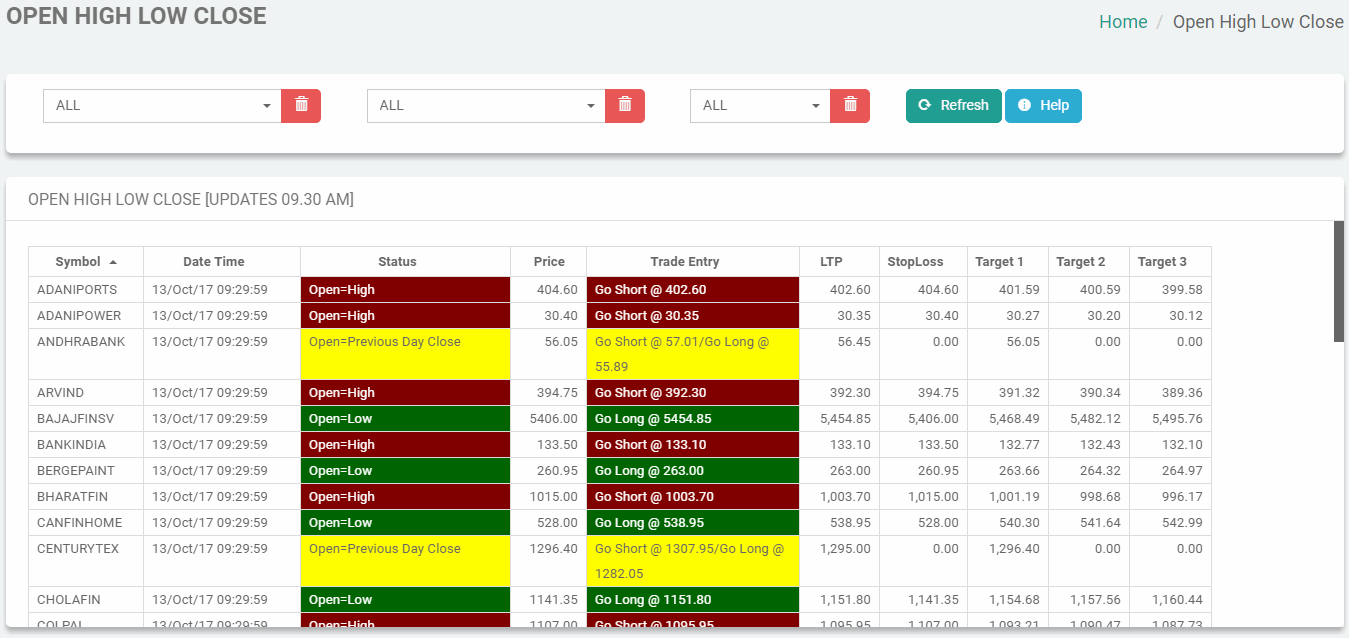
How to Scan for Open-High-Low-Close?
Once you launch Open-High-Low-Close screen by default you will get the list of stocks traded. Typically updates happens anywhere 9.30a.m during the trading session.
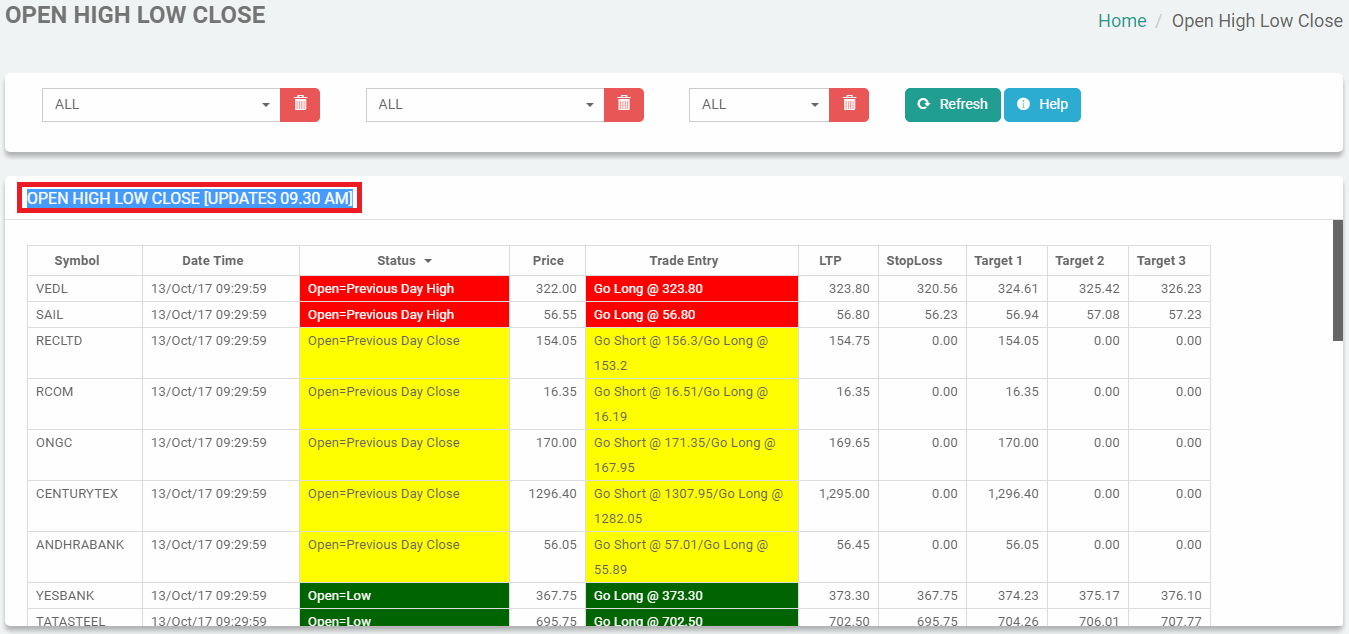
Options in this scanner
If open=high, go short with open price as stoploss
If open=prev.dayhigh, go long with 1% stoploss from LTP
If open=low, go long with open price as stoploss
If open=prev.daylow, go short with 1% stoploss from LTP
If open=prev.dayclose,
If the price up by 1% from LTP , go short with 0.5% stoploss from the entry price
If the price down by 1% from LTP , go long with 0.5% stoploss from the entry price
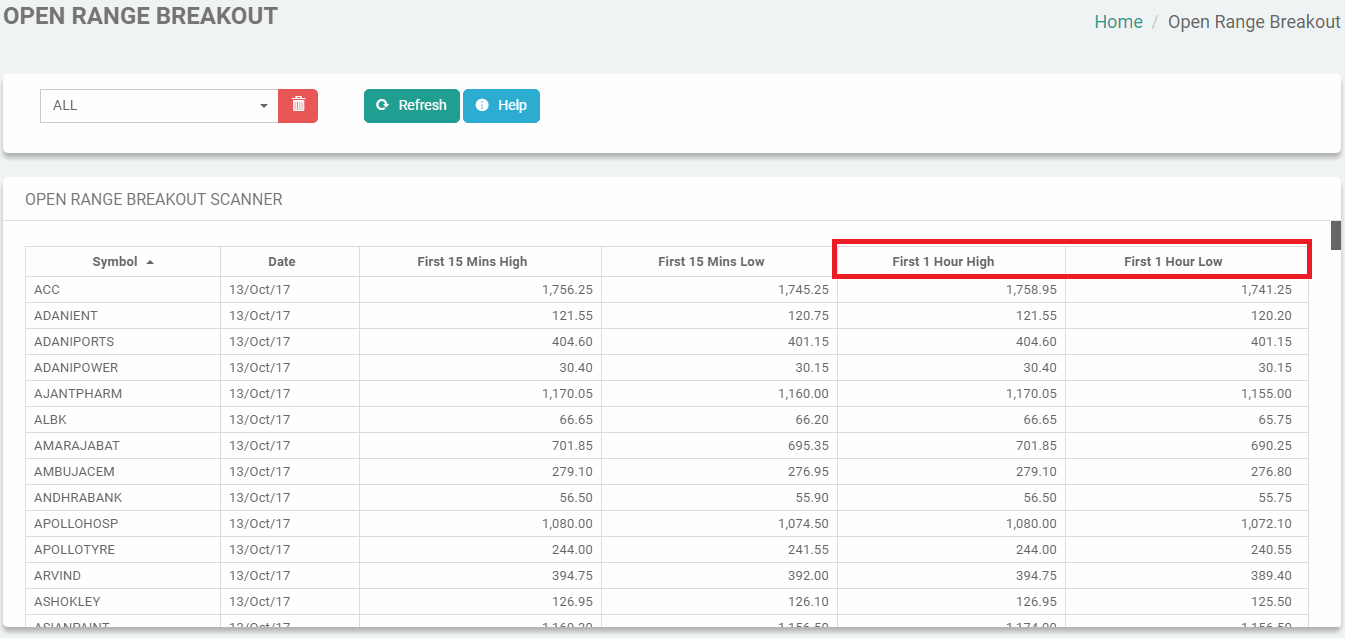
OPEN RANGE BREAKOUT
About Open Range Breakout
Open Range Breakout is a scanner that any stock creates a range in the first 15 to 60 minutes of trading in a day. This is called Opening Range. The highs and lows of this timeframe is taken as resistance and support.
1. Buy when the stock moves above the Opening Range high(ORB High).
2. Sell when the stock moves below the Opening Range low(ORB Low).
Opening range is defined by the high and low made in the first 15 minutes or 60 minutes.
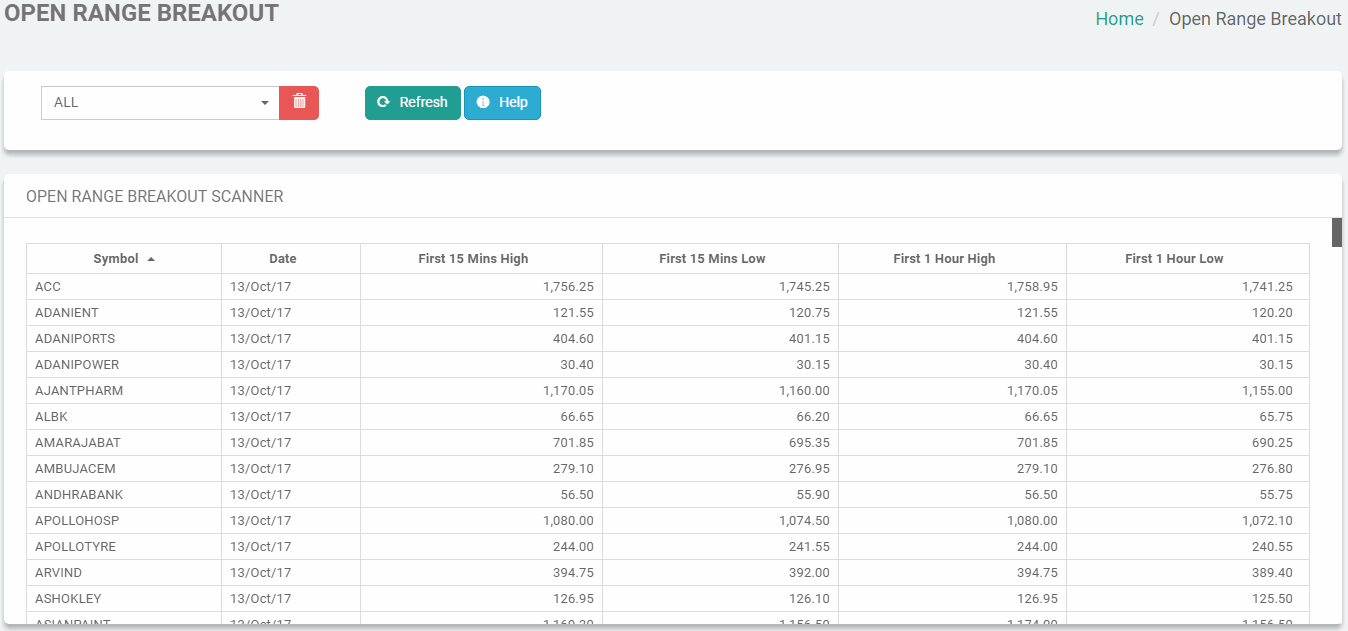
First 15 minutes Open High-Low.
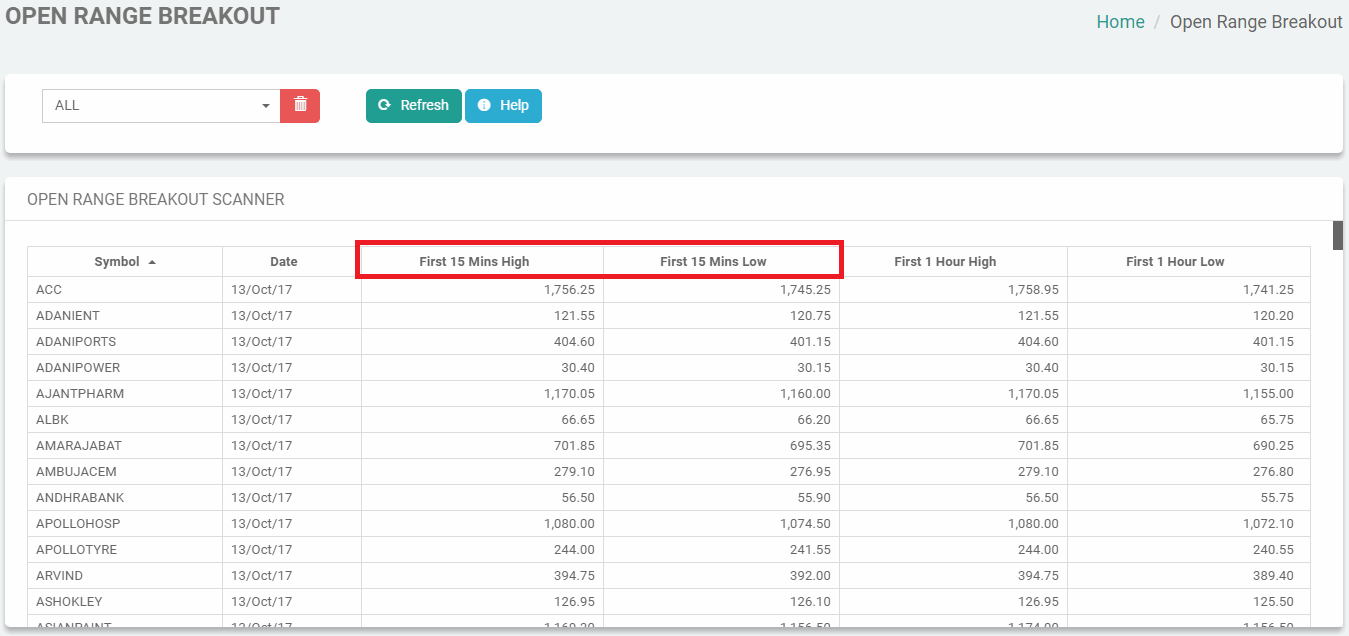
First 60 minutes Open High-Low.
Rules for Buy
Buy when the stock price crosses above the opening range.
Initial Stoploss – Low of the Opening Range.
Rules for Sell
Sell when the stock price crosses below the opening range.
Initial Stoploss – High of the Opening Range.
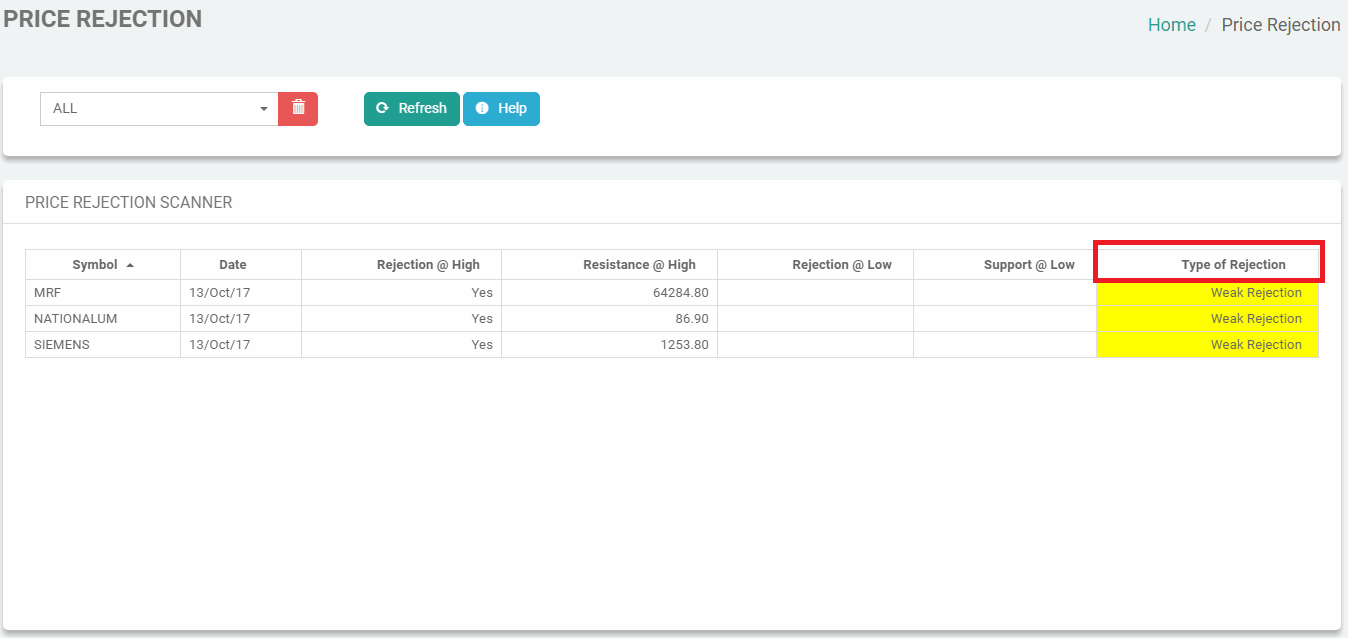
PRICE REJECTION
About Price Rejection
Price Rejection is a simple gap rejection technique where price opens above yesterday's high or yesterday's low and completely reverse in the first 1 hour of the trading. Rest of the day price trades below yesterday's high (Price Rejection @ High) after gap-up or yesterday's low after gap-down open(Price Rejection @ Low).
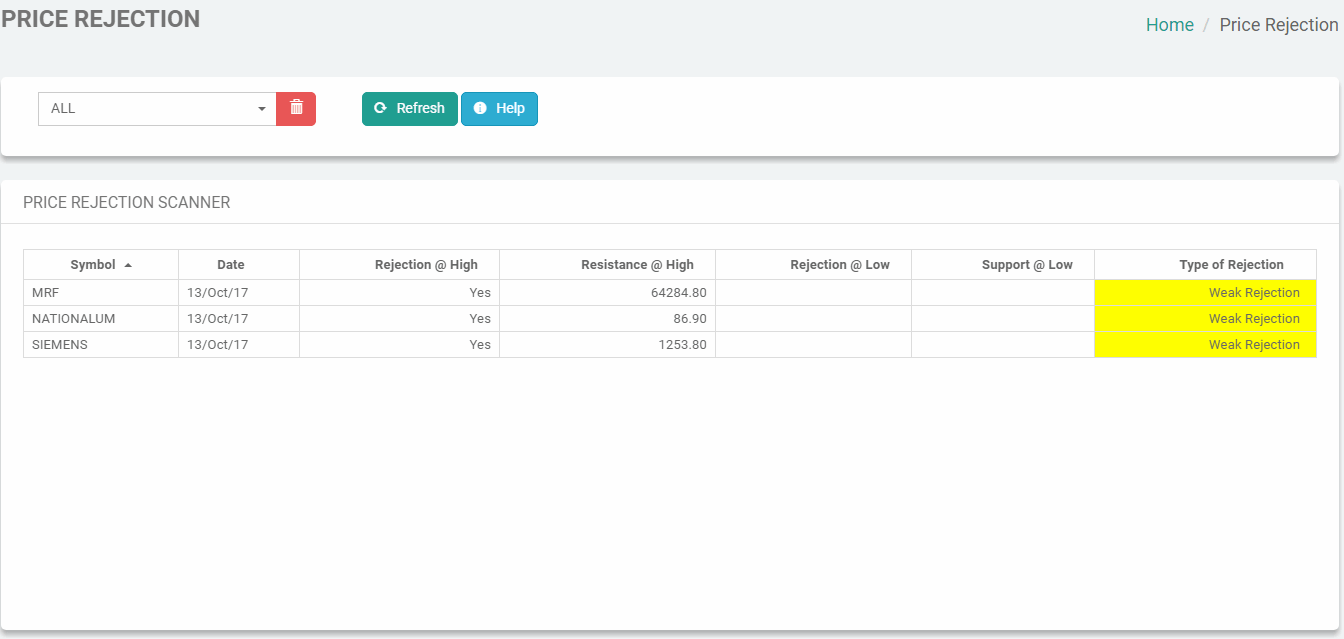
In case of Price Rejection @ High - Yesterday's High will act as a potential resistance.
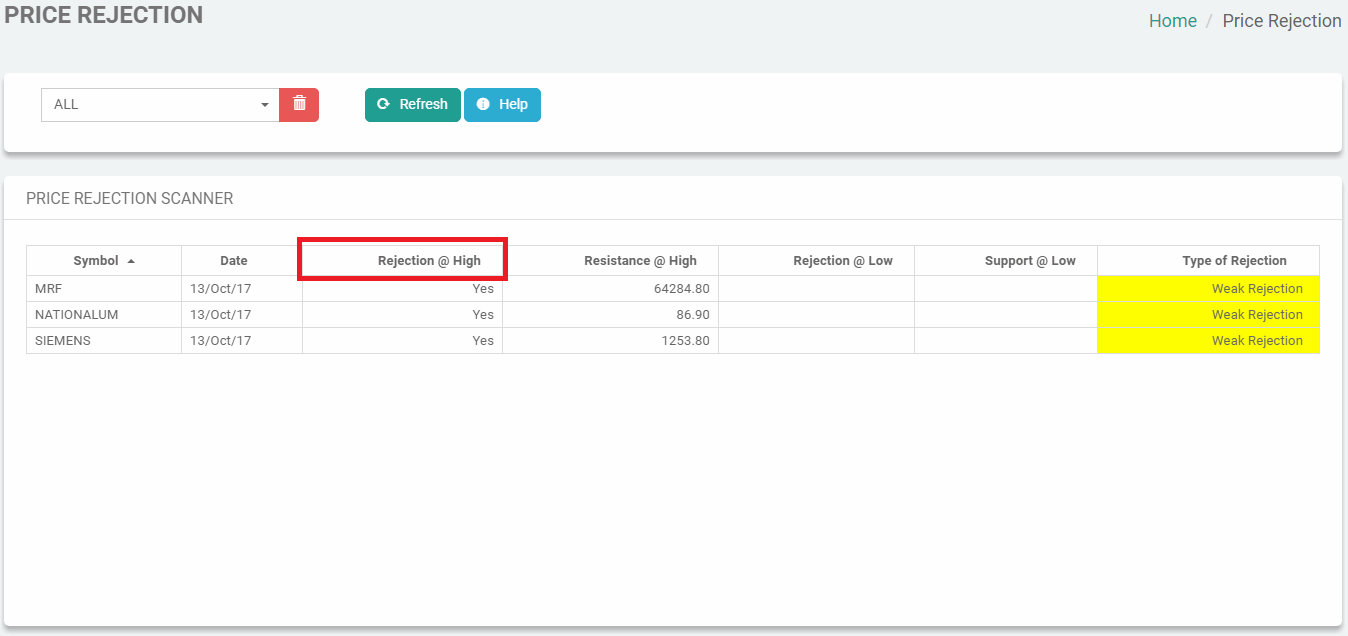
In case of Price rejection @ Low - Yesterday's Low will act as a potential support.
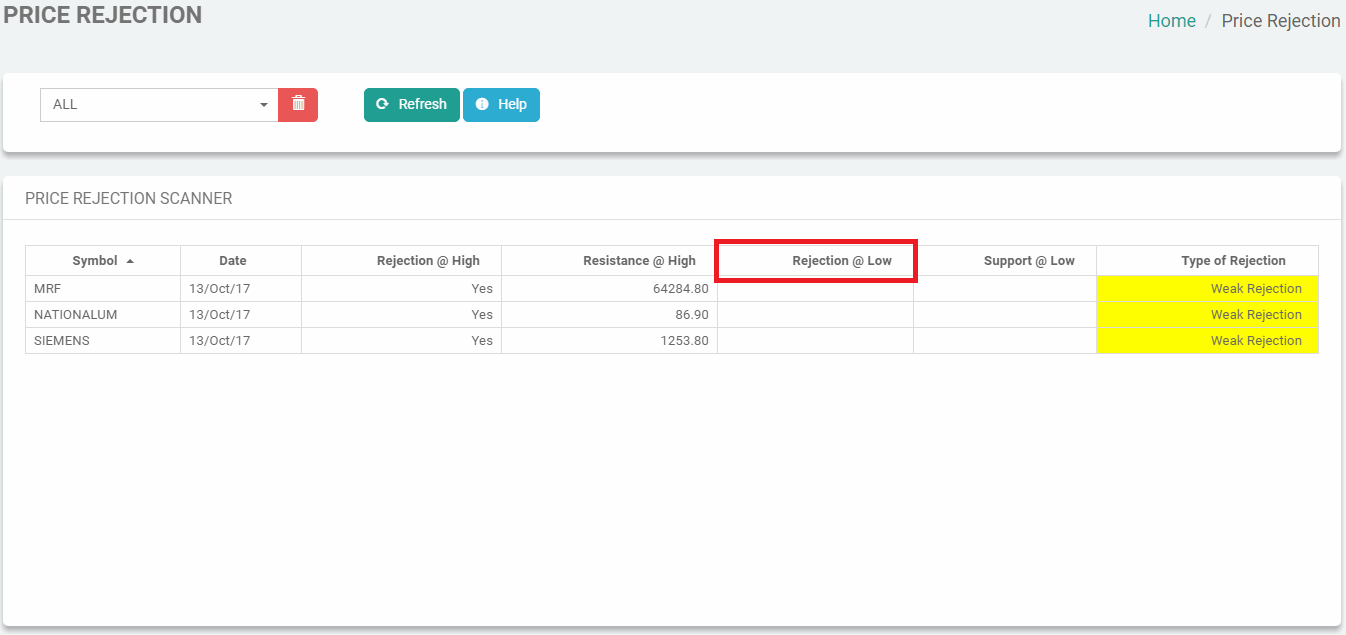
Rejection is classified as Strong Rejection or Weak Rejection based on the volume transactions in a particular trading instrument. Strong rejection implies a possible top/bottom formation with higher volume. Weak rejection happens with low volumes are likely to act as weak resistance/support levels and once can anticipate a revisit towards the levels.
FAQ
WHAT ARE THE SIGNAL STATUS AVAILABLE?
• Ready to Buy
• Buy Signal
• Ready to Short
• Short Signal
• No Trade Zone
WHAT IS "READY TO BUY"?
"Ready to Buy" means, symbol is in the buying zone.
Anytime symbol will touch the specified price mentioned in the Charting Dashboard(Bottom Left Corner of the Chart).
Hence the trader is recommended to place the Limit Buy Order at the specified price.
WHERE TO SEE "READY TO BUY"?
"Ready to Buy" status can be identified in any of the following ways. 1. Charting Dashboard(Bottom Left Corner of the Chart). 2. Charting candle colour will change from RED to GREEN. 3. In TXScanner screen.
HOW LONG "READY TO BUY" LIMIT BUY ORDER IS VALID?
Limit Buy Order is valid as long as the charting candle remains GREEN and Charting Dashboard shows "Ready to Buy".
WHEN TO CANCEL THE "READY TO BUY" LIMIT BUY ORDER?
Traders are recommended to cancel the pending Limit Buy Order when the candle turns to RED from GREEN and "Ready to Buy" status disappears from Charting Dashboard. Also , Cancel the pending "Ready to Buy" Limit Buy order when the system generates "Ready to Short" signal without "Buy Signal".
WHAT IS "BUY SIGNAL"?
When the "Ready to Buy" Limit Buy Order touches the specified price, "Buy Signal" will be generated with a Buy Arrow(UP GREEN Arrow) will appear in the chart. It means your Buy Limit Order is executed.
WHERE TO SEE "BUY SIGNAL"?
"Buy Signal" status can be identified in any of the following ways. 1. Charting Dashboard(Bottom Left Corner of the Chart). 2. Buy Arrow(UP GREEN Arrow) will be generated in chart. 3. In TXScanner screen.
WHEN WILL "BUY SIGNAL" BE EXECUTED?
"Buy Signal" will be executed when the current symbol price touches the already placed "Limit Buy Order" price.
WHEN TO EXIT "BUY SIGNAL"?
EXIT the "Buy Signal" can be done in any of the following situations 1. When the symbol current price touches any of the defined Targets and want to book a partial profit, you can place a "Sell Order" to EXIT. This can be identified in the TXSignal Chart. 2. When the system generates "Ready to Short" signal, You need to place a "Limit Sell Order" with minimum double the quantity of the executed "Buy Order". This will cover the executed "Buy Order" position and open a new Short position when the symbol current price touches the specified price mentioned in the "Limit Sell Order".
WHAT IS "READY TO SHORT"?
"Ready to Short" means, symbol is in the selling zone. Anytime symbol will touch the specified price mentioned in the Charting Dashboard(Bottom Left Corner of the Chart). Hence the trader is recommended to place the Limit Sell Order at the specified price. If the "Buy Signal" is already executed, You need to place a "Limit Sell Order" with minimum double the quantity of the executed "Buy Order".
WHERE TO SEE "READY TO SHORT"?
"Ready to Short" status can be identified in any of the following ways. 1. Charting Dashboard(Bottom Left Corner of the Chart). 2. Charting candle colour will change from RED to GREEN. 3. In TXScanner screen.
HOW LONG "READY TO SHORT" LIMIT SELL ORDER IS VALID?
Limit Sell Order is valid as long as the charting candle remains GREEN and Charting Dashboard shows "Ready to Short".
WHEN TO CANCEL THE "READY TO SHORT" LIMIT SELL ORDER?
Traders are recommended to cancel the pending Limit Sell Order when the candle turns to RED from GREEN and "Ready to Short" status disappears from Charting Dashboard. Also , Cancel the pending "Ready to Short" Limit Sell order when the system generates "Ready to Buy" signal without "Sell Signal".
WHAT IS "SHORT SIGNAL"?
When the "Ready to Short" Limit Sell Order touches the specified price, "Short Signal" will be generated with a Sell Arrow(DOWN RED Arrow) will appear in the chart. It means your Short Limit Order is executed.
WHERE TO SEE "SHORT SIGNAL"?
"Short Signal" status can be identified in any of the following ways. 1. Charting Dashboard(Bottom Left Corner of the Chart). 2. Sell Arrow(DOWN RED Arrow) will be generated in chart. 3. In TXScanner screen.
WHEN WILL "SHORT SIGNAL" BE EXECUTED?
"Short Signal" will be executed when the current symbol price touches the already placed "Limit Short Order" price.
WHEN TO EXIT "SHORT SIGNAL"?
EXIT the "Short Signal" can be done in any of the following situations 1. When the symbol current price touches any of the defined Targets and want to book a partial profit, you can place a "Buy Order" to EXIT. This can be identified in the TXSignal Chart. 2. When the system generates "Ready to Buy" signal, You need to place a "Limit Buy Order" with minimum double the quantity of the executed "Sell Order". This will cover the executed "Sell Order" position and open a new Buy position when the symbol current price touches the specified price mentioned in the "Limit Buy Order".
WHAT IS NO TRADE ZONE?
It is a status to avoid bad trading signals or whipsaws. No Signals will be generated for that particular day. This status can be identified in Charting Dashboard(Bottom Left Corner of the Chart).
WHAT IS TARGET?
It is a price zone where you can book you profit partially.
HOW TARGETS ARE CALCULATED?
Targets are calculated using Fibonacci based proprietary model.
WHEN TO SQUARE-OFF THE INTRADAY POSITIONS OR CANCEL THE PENDING ORDERS?
3PM is the system Square-Off time, Trader is recommended to Square-Off the Intraday positions or cancel the pending orders, if any.
WHAT DO YOU MEAN "TIME LEFT" IN TXSIGNALS CHART?
Time left : Shows how many seconds left for the current bar to complete. If "Time Left" shows 199 then 199 seconds are left for the current bar to complete and new bar to form.
Useful Links
Problems/Feedback
Feel free to contact us at support@tradeaction.in
The platform is highly configurable
Let's hope you, the user, find the platform useful and fun to work with. 😀